 Oracle Solutions We believe in delivering tangible results for our customers in a cost-effective manner
Employee Task Scheduling and Timeline Visualization Using Oracle JET Charts
Author: Zulqarnain Haider
Oracle APEX Version: 26.1
Technologies: Oracle APEX, Oracle JET Charts, SQL, PL/SQL, JavaScript, CSS
1. Introduction
Project planning and task management require a clear understanding of activities, schedules, and resource assignments. Traditional reports display task information in rows and columns, but they do not always provide a clear visual representation of project timelines.
A Gantt Chart solves this problem by displaying tasks as horizontal bars across a timeline. It allows users to identify task durations, start dates, end dates, and employee assignments in a single view.
In this article, I will demonstrate how to build an interactive Gantt Chart using Oracle APEX Native JET Charts.
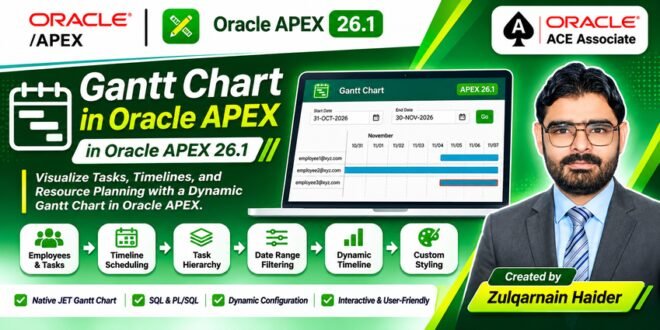
The application displays employee tasks in a hierarchical structure, supports date-range filtering, dynamically adjusts the timeline scale, applies custom task colors, and highlights the current date.
2. Project Overview
The Gantt Chart Demo application provides a visual timeline for employee task scheduling.
Key features:
-
Employee-wise task visualization.
-
Parent-child task hierarchy.
-
Start date and end date filtering.
-
Dynamic timeline scaling.
-
Custom colors for different task categories.
-
Task information through chart tooltips.
-
Today’s date highlighting.
-
Oracle APEX Native JET Chart integration.
3. Application Architecture
The application uses Oracle APEX native components and an SQL-based data source.
| Component | Purpose |
|---|---|
| Native JET Chart | Displays the Gantt Chart |
| SQL Query | Retrieves employee and task information |
| PL/SQL | Initializes dates and calculates timeline duration |
| JavaScript | Configures the timeline dynamically |
| Dynamic Action | Highlights today’s date |
| CSS | Customizes task appearance |
The main Gantt Chart is implemented on Page 1.
4. Database Structure and Sample Data
The application export includes an installation script that creates a sample view named BLOG_GANTT_TASKS_V.
The view provides employee task information, including task ID, employee email, task name, start date, end date, billable flag, and task type.
The following is the sample view definition included in the application export:
CREATE OR REPLACE FORCE VIEW BLOG_GANTT_TASKS_V AS

SELECT
    1 TASK_ID,
    'employee1@xyz.com' EMAIL_ADDRESS,
    'Employee 1 Task' TASK_NAME,
    TRUNC(SYSDATE) - 1 START_DATE,
    TRUNC(SYSDATE) + 3 END_DATE,
    'Y' BILLABLE_FLAG,
    'TASK' TASK_TYPE
FROM DUAL

UNION ALL

SELECT
    2,
    'employee1@xyz.com',
    'Pre-Sales - Demo to Customer',
    TRUNC(SYSDATE) + 22,
    TRUNC(SYSDATE) + 22,
    'N',
    'TASK'
FROM DUAL

UNION ALL

SELECT
    3,
    'employee1@xyz.com',
    'Vacation',
    TRUNC(SYSDATE) + 10,
    TRUNC(SYSDATE) + 20,
    'N/A',
    'LEAVE'
FROM DUAL

UNION ALL

SELECT
    4,
    'employee2@xyz.com',
    'New Assignment',
    TRUNC(SYSDATE) - 30,
    TRUNC(SYSDATE) + 5,
    'Y',
    'TASK'
FROM DUAL

UNION ALL

SELECT
    5,
    'employee3@xyz.com',
    'Internal Meeting (non-billable)',
    TRUNC(SYSDATE) - 1,
    TRUNC(SYSDATE) + 1,
    'N',
    'TASK'
FROM DUAL;
This sample data provides different task scenarios, including regular assignments, leave activities, and non-billable tasks.
Note: This view is demonstration data from the application export. In a production application, it can be replaced with actual employee and project task tables.
5. Creating the Gantt Chart Region
Create a new region on Page 1 in Oracle APEX.
Configure the region as follows:
| Property | Value |
|---|---|
| Region Name | Gantt Chart |
| Region Type | Native JET Chart |
| Chart Type | Gantt |
| Static ID | gantt-chart |
| Height | 400 |
| Data Source Type | SQL Query |
| Tooltip | Enabled |
| Legend | Enabled |
| Lazy Loading | Enabled |
The chart uses an SQL query to retrieve employee and task information.
6. SQL Query for Employee and Task Hierarchy
One of the important parts of the implementation is creating a parent-child relationship between employees and their tasks.
The query uses a Common Table Expression (CTE) to generate employee records and then combines them with task records using UNION ALL.
Gantt Chart SQL Query:
WITH EMP AS (
    SELECT
        LEVEL EMP_ID,
        'employee' || LEVEL || '@xyz.com' EMAIL_ADDRESS
    FROM DUAL
    CONNECT BY LEVEL < 4
)

-- Employee Records
SELECT
    'EMP' || EMP.EMP_ID TASK_ID,
    NULL PARENT_TASK_ID,
    EMP.EMAIL_ADDRESS,
    EMP.EMAIL_ADDRESS TASK_NAME,
    NULL START_DATE,
    NULL END_DATE,
    'EMPLOYEE' TASK_TYPE,
    NULL CSS_CLASS,
    NULL CUST_TOOLTIP
FROM EMP

UNION ALL

-- Employee Tasks
SELECT
    'TK' || TASK.TASK_ID TASK_ID,
    'EMP' || EMP.EMP_ID PARENT_TASK_ID,
    EMP.EMAIL_ADDRESS,
    TASK.TASK_NAME,
    TASK.START_DATE,
    TASK.END_DATE + 1 - 1 / 1440 END_DATE,
    TASK.TASK_TYPE,

    CASE
        WHEN TASK.TASK_TYPE = 'LEAVE'
        THEN 'demo-f-orange'
    END || ' ' ||

    CASE
        WHEN TASK.BILLABLE_FLAG = 'N'
        THEN 'demo-b-red'
        ELSE NULL
    END CSS_CLASS,

    TASK.TASK_TYPE CUST_TOOLTIP

FROM EMP
JOIN BLOG_GANTT_TASKS_V TASK
    ON TASK.EMAIL_ADDRESS = EMP.EMAIL_ADDRESS;
Understanding the SQL Query
1. Employee Generation
The CTE generates three sample employee records using:
CONNECT BY LEVEL < 42. Employee Parent Records
Employee records are created with IDs such as EMP1, EMP2, and EMP3.
3. Task Child Records
Each task receives an ID such as TK1, TK2, and is connected to its employee through PARENT_TASK_ID.
4. Task Duration
The end date expression:
TASK.END_DATE + 1 - 1 / 1440Adjusts the task end boundary to the final minute of the end date.
5. CSS Class Assignment
Leave tasks receive the demo-f-orange class, while non-billable tasks receive the demo-b-red class.
7. Gantt Chart Column Mapping
After configuring the SQL query, map the query columns to the Gantt Chart attributes.
| Gantt Chart Attribute | SQL Column |
|---|---|
| Row ID | PARENT_TASK_ID |
| Row Name | EMAIL_ADDRESS |
| Task ID | TASK_ID |
| Task Name | TASK_NAME |
| Task Start Date | START_DATE |
| Task End Date | END_DATE |
| Task CSS Class | &CSS_CLASS. |
The parent-child mapping allows the chart to display employee records with their associated tasks.
8. Start Date and End Date Filters
The application provides two date picker items:
-
P1_START_DATE -
P1_END_DATE
It also uses two hidden items:
-
P1_END_DATE_HIDDEN -
P1_GANTT_DAYS
These items control the selected timeline and its duration.
PL/SQL Process: Set Default Values
The following process initializes the default date range when the page opens.
IF :P1_START_DATE IS NULL THEN

    :P1_START_DATE :=
        TO_CHAR(SYSDATE - 15, 'DD-MON-YYYY');

    :P1_END_DATE :=
        TO_CHAR(SYSDATE + 15, 'DD-MON-YYYY');

    :P1_END_DATE_HIDDEN :=
        TO_CHAR(SYSDATE + 16, 'DD-MON-YYYY');

END IF;
This provides a default timeline covering 15 days before and 15 days after the current date.
Page Computation: End Date
When the user clicks the Go button, the application calculates the hidden end-date boundary.
TO_DATE(:P1_END_DATE, 'DD-MON-YYYY') + 1This computation is associated with the GO request.
PL/SQL Process: Calculate Gantt Days
The application calculates the total number of days between the selected dates.
:P1_GANTT_DAYS :=
    TO_DATE(:P1_END_DATE, 'DD-MON-YYYY')
    -
    TO_DATE(:P1_START_DATE, 'DD-MON-YYYY');
The calculated value is used by JavaScript to configure the timeline scale.
9. Dynamic Timeline Scaling Using JavaScript
A Gantt Chart should display the timeline differently depending on the selected date range.
For example, a 30-day schedule should show daily intervals, while a two-year schedule should use a broader timeline.
The application uses the Native JET Chart JavaScript Initialization Code to configure the major and minor axes.
JavaScript Code:
function (options) {

    var windowDays = $v("P1_GANTT_DAYS");

    if (windowDays > 0 && windowDays <= 90) {

        options.minorAxis = {
            "scale": "days",
            "zoomOrder": [
                "quarters",
                "months",
                "weeks",
                "days"
            ]
        };

        options.majorAxis = {
            "scale": "months",
            "zoomOrder": [
                "months",
                "weeks",
                "days"
            ]
        };

    } else if (windowDays > 90 && windowDays <= 270) {

        options.minorAxis = {
            "scale": "months",
            "zoomOrder": [
                "quarters",
                "months",
                "weeks",
                "days"
            ]
        };

        options.majorAxis = {
            "scale": "quarters",
            "zoomOrder": [
                "quarters",
                "months",
                "weeks",
                "days"
            ]
        };

    } else if (windowDays > 270 && windowDays <= 730) {

        options.minorAxis = {
            "scale": "months",
            "zoomOrder": [
                "quarters",
                "months",
                "weeks",
                "days"
            ]
        };

        options.majorAxis = {
            "scale": "years",
            "zoomOrder": [
                "years",
                "quarters",
                "months",
                "weeks",
                "days"
            ]
        };

    } else {

        options.minorAxis = {
            "scale": "quarters",
            "zoomOrder": [
                "quarters",
                "months",
                "weeks",
                "days"
            ]
        };

        options.majorAxis = {
            "scale": "years",
            "zoomOrder": [
                "years",
                "quarters",
                "months",
                "weeks",
                "days"
            ]
        };

    }

    return options;
}
Timeline Configuration
| Date Range | Major Axis | Minor Axis |
|---|---|---|
| 1–90 days | Months | Days |
| 91–270 days | Quarters | Months |
| 271–730 days | Years | Months |
| More than 730 days | Years | Quarters |
This approach improves chart readability and provides an appropriate timeline for different scheduling periods.
10. Custom Task Styling
The application uses CSS classes to distinguish task categories.
The SQL query assigns these classes dynamically.
| CSS Class | Purpose |
|---|---|
demo-f-orange |
Orange task fill for leave activities |
demo-b-red |
Red border for non-billable activities |
This makes it easier for users to identify leave and non-billable activities directly from the chart.
The styling can be extended with additional CSS classes for project categories, task status, priority, and other business requirements.
11. Highlighting Today’s Date Using Dynamic Actions
The application includes a Dynamic Action named:
Highlight Todays Date
It is configured on the Gantt Chart region using the apexafterrefresh event.
This allows the highlighting logic to run after the chart refreshes.
JavaScript Code:
var today = new Date();

// Default Gantt date format: MM/DD
var todayGanttFormat =
    (today.getMonth() + 1) + "/" + today.getDate();

// Gantt Chart region Static ID: gantt-chart
$("text.oj-gantt-minor-axis-label", "#gantt-chart")
    .each(function () {

        if ($(this).html() == todayGanttFormat) {

            // Highlight today's date in red
            $(this).css("fill", "red");

        }

    });
Dynamic Action Configuration
| Property | Value |
|---|---|
| Dynamic Action Name | Highlight Todays Date |
| Event | After Refresh |
| Selection Type | Region |
| Region | Gantt Chart |
| Action | Execute JavaScript Code |
This enhancement provides a visual reference for the current date on the timeline.
12. Complete Application Workflow
The application follows this workflow:
flowchart TD
    A([User Login]) --> B[Open Gantt Chart Page]
    B --> C[Initialize Default Dates]
    C --> D[Select Start and End Dates]
    D --> E[Click Go Button]
    E --> F[Calculate Date Range]
    F --> G[Execute Gantt Chart SQL]
    G --> H[Generate Employee Records]
    H --> I[Retrieve Employee Tasks]
    I --> J[Map Parent and Child Tasks]
    J --> K[Configure Timeline Scale]
    K --> L[Render Oracle JET Gantt Chart]
    L --> M[Highlight Today's Date]
    M --> N([Display Interactive Timeline])
13. Practical Business Use Cases
The same implementation approach can be adapted for:
-
Project management and task scheduling.
-
Employee workload planning.
-
Resource allocation.
-
Leave and attendance planning.
-
Software development schedules.
-
Construction project timelines.
-
Production planning.
-
Project milestone tracking.
By connecting the Gantt Chart to actual business tables, organizations can visualize their operational activities and resource schedules.
14. Future Enhancements
The current application provides a foundation for timeline visualization. It can be extended with additional enterprise features, including:
-
Task creation and editing.
-
Task progress tracking.
-
Project milestones.
-
Task dependencies.
-
Department and project filters.
-
Employee workload dashboards.
-
Task status indicators.
-
Role-based authorization.
-
Integration with existing project management systems.
15. Conclusion
Building an interactive Gantt Chart in Oracle APEX demonstrates how native Oracle JET Charts can be used to create meaningful and dynamic business visualizations.
By combining SQL-based data preparation, hierarchical task mapping, PL/SQL date calculations, JavaScript timeline configuration, and custom CSS, developers can build a flexible scheduling interface within Oracle APEX.
This project highlights the capabilities of Oracle APEX Native JET Charts and demonstrates how standard APEX components can be extended to solve practical business requirements.
16. Oracle ACE Associate Contribution
This article is part of my technical knowledge-sharing contribution to the Oracle community as I work toward the Oracle ACE Associate program.
Through this project, I aim to share practical Oracle APEX development techniques, demonstrate the capabilities of Oracle JET Charts, and help fellow developers understand how to build interactive, data-driven business applications.
Article Title: Building an Interactive Gantt Chart in Oracle APEX
Category: Oracle APEX Development / Data Visualization
Technologies: Oracle APEX 26.1, Oracle JET Charts, SQL, PL/SQL, JavaScript, CSS