 Oracle Solutions We believe in delivering tangible results for our customers in a cost-effective manner
Part I — Understanding Database Health Checks
1.1 What Is a Database Health Check?
A database health check is a structured review of an Oracle Database instance and its supporting infrastructure, run on a regular cadence, to catch problems while they are still cheap to fix. It is deliberately broader than performance tuning: a health check also looks at backup readiness, storage headroom, security posture, and scheduled job health, not just SQL response time. The output of a health check is not a fix, it is a signal: which areas are green, which are drifting, and which need action before they become an incident.
1.2 The Health Check Categories
Every mature health check routine covers the same six categories, regardless of the exact tool used to run it:
- Availability: Is the instance up, reachable, and free of critical errors in the alert log
- Storage: Tablespace free space, datafile autoextend headroom, undo and temp usage
- Memory: SGA and PGA sizing, buffer cache efficiency, library cache health
- Performance: Top wait events, blocking sessions, long-running or runaway SQL
- Object & Security Integrity: Invalid objects, locked or expiring accounts, failed scheduler jobs
- Backup & Recovery Readiness: Whether a restore would actually succeed today, not just whether a backup job reported success
Availability → Storage → Memory → Performance → Object/Security Integrity → Backup Readiness
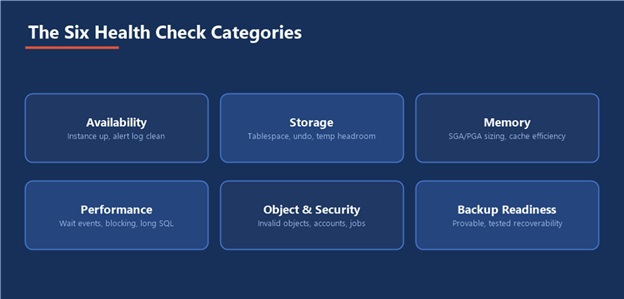
Figure 1 — The six categories every mature health check routine covers
1.3 Manual Checks vs. Automated Monitoring
A health check and continuous monitoring are complementary, not competing. Monitoring (Enterprise Manager, a metrics agent, custom alerting) catches sudden breaches of a threshold in near real time. A health check catches the slow drift that thresholds alone miss a tablespace growing 2% a week that will not breach an alert threshold for another four months, or a backup that has quietly stopped covering one datafile. Run monitoring continuously; run a health check on a schedule, precisely because it looks at trend and completeness, not just the current value.
1.4 Key Tools
- Dynamic performance views (V$ views): real-time instance state: sessions, wait events, memory structures
- Data dictionary views (DBA_ views): persistent metadata: tablespaces, objects, users, scheduled jobs
- AWR (Automatic Workload Repository): historical performance snapshots, the basis for trend analysis and AWR reports
- ADDM (Automatic Database Diagnostic Monitor): automated analysis of AWR data, producing ranked findings and recommendations
- The alert log and ADRCI: the first place any serious instance-level problem announces itself
- RMAN reporting commands the only reliable source of truth for backup and recovery readiness
A health check that only looks at today’s numbers will miss every problem that is still three weeks away from mattering.
Part II — A Health Check Methodology
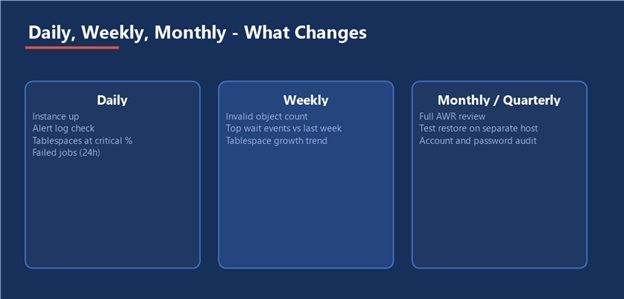
Figure 2 — What gets checked at each cadence, before the detail below
2.1 Daily Checks
Fast, low-cost checks that catch anything that would hurt if left for a week:
- Instance up, last backup succeeded, no new critical errors in the alert log
- Tablespaces above a critical usage threshold (typically 90–95%)
- Failed scheduler jobs from the last 24 hours
2.2 Weekly Checks
- Invalid object count and a recompile pass if the count is climbing
- Top wait events and top SQL by elapsed time over the past week, compared against the prior week
- Tablespace growth trend, not just current usage — project forward to the next likely resize date
2.3 Monthly / Quarterly Checks
- A full AWR review across the period, looking for slow-building regressions rather than single spikes
- A test restore of a recent RMAN backup, on a separate host, to prove recoverability rather than assume it
- A password and account audit: expiring accounts, default passwords, unused privileged accounts
2.4 Setting Thresholds and Escalation
Every check needs a threshold and an owner, not just a query. A tablespace at 88% used means nothing on its own; it means something when compared against “escalate at 90%, page someone at 95%.” Write the threshold and the escalation action down next to the check itself, not in a separate document someone has to go find at 2 a.m.
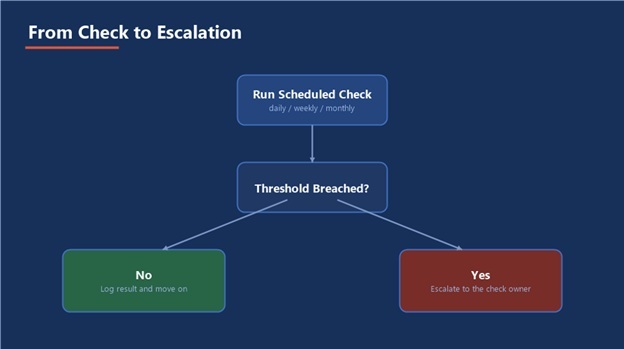
Figure 3 — Every check needs this fork wired up before it is worth running
Trend beats snapshot: A single reading tells you where you are; the same check run weekly tells you where you are heading. Store health check results somewhere queryable, even if it is just a dated spreadsheet, so this quarter’s numbers can be compared against last quarter’s.
Part III — Diagnostic Areas and Scripts
3.1 Instance and Availability
SELECT instance_name, status, database_status, startup_time FROM v$instance; SELECT name, description FROM v$bgprocess WHERE paddr <> ’00’;
For the alert log, use ADRCI rather than hunting for the raw file:
adrci> show alert -tail 50 -term “ORA-“
3.2 Storage and Tablespace Health
SELECT tablespace_name, ROUND(used_percent, 2) AS used_pct FROM dba_tablespace_usage_metrics ORDER BY used_percent DESC; SELECT file_name, autoextensible, maxbytes, bytes FROM dba_data_files WHERE autoextensible = ‘YES’ AND bytes >= maxbytes * 0.95;
Undo and temp usage deserve their own check, since they fill differently than data tablespaces:
SELECT tablespace_name, used_blocks, tablespace_size FROM v$sort_segment;
3.3 Memory Health
SELECT name, value FROM v$sga; SELECT name, value FROM v$pgastat WHERE name = ‘total PGA allocated’; SELECT metric_name, value FROM v$sysmetric WHERE metric_name = ‘Buffer Cache Hit Ratio’;
A buffer cache hit ratio that has quietly dropped over several weeks is a much stronger signal than one bad reading on a busy day this is exactly the kind of trend a snapshot alone would miss.
3.4 Performance and Wait Events
SELECT event, total_waits, time_waited FROM v$system_event ORDER BY time_waited DESC FETCH FIRST 10 ROWS ONLY; SELECT blocking_session, sid, serial#, wait_class, seconds_in_wait FROM v$session WHERE blocking_session IS NOT NULL;
Long-running operations that are still in progress large index builds, big batch jobs are worth a dedicated check so they do not get mistaken for a stuck session:
SELECT sid, serial#, sql_id, opname, sofar, totalwork, ROUND(sofar/totalwork*100, 1) AS pct_done FROM v$session_longops WHERE totalwork > 0 AND sofar < totalwork;
3.5 Object and Security Integrity
SELECT owner, object_type, COUNT(*) AS invalid_count FROM dba_objects WHERE status = ‘INVALID’ GROUP BY owner, object_type ORDER BY invalid_count DESC; EXEC UTL_RECOMP.RECOMP_SERIAL();
SELECT username, account_status, expiry_date FROM dba_users WHERE account_status != ‘OPEN’ OR expiry_date < SYSDATE + 7;
SELECT job_name, status, log_date FROM dba_scheduler_job_run_details WHERE status = ‘FAILED’ ORDER BY log_date DESC;
3.6 Backup and Recovery Readiness
Do this from RMAN, not from a job-scheduler success flag a job can report success while a backup piece is silently missing:
RMAN> LIST BACKUP SUMMARY; RMAN> REPORT NEED BACKUP DAYS 1; RMAN> CROSSCHECK BACKUP;
For the full backup and recovery methodology, including retention policy, incremental strategy, and every recovery scenario, see the companion guide Oracle RMAN Complete Backup & Recovery Guide in this series.
Part IV — Using AWR and ADDM
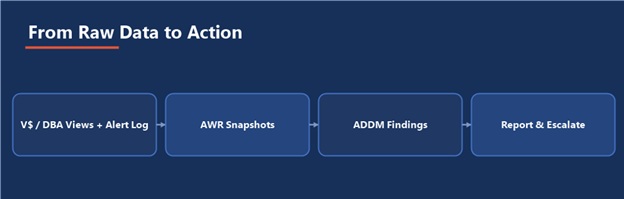
Figure 4 — How raw instance data becomes a ranked, actionable finding
4.1 Generating an AWR Report
AWR snapshots are taken automatically (every 60 minutes by default) and retained for a configurable window (8 days by default). To compare two snapshots as a report:
SQL> @$ORACLE_HOME/rdbms/admin/awrrpt.sql
The script prompts for a report format, a begin and end snapshot ID, and an output file name. Always pick a begin/end pair that brackets the exact window you are investigating a report spanning 24 hours will average away the 15-minute spike you actually care about.
4.2 ADDM Recommendations
ADDM runs automatically after every AWR snapshot and ranks findings by estimated impact, which makes it the fastest way to triage a performance complaint before writing a single diagnostic query by hand:
SQL> @$ORACLE_HOME/rdbms/admin/addmrpt.sql
4.3 Automating the Routine
Wrap the daily and weekly queries from Part III into a PL/SQL procedure, schedule it withDBMS_SCHEDULER, and have it write results to a dedicated logging table (or email a summary via UTL_MAIL). The goal is that no one has to remember to run the health check it shows up in an inbox, and a human only has to act when something is red.
AWR retention is not infinite: The default 8-day window means last quarter’s baseline is gone unless you extended retention or archived the report. Decide your retention window deliberately, based on how far back you actually need to compare, not the out-of-the-box default.
Part V — Practical Guidance
5.1 A Sample Daily Health Check Run
Instance Status → Alert Log → Tablespace Usage → Failed Jobs → Last Backup Status
This five-check pass takes under ten minutes and catches the overwhelming majority of problems that would otherwise surface as an incident before the next scheduled deeper review.
5.2 A Health Check Report Template
|
Area |
Check |
Threshold |
Status |
|
Availability |
Instance status, critical alert log errors |
0 critical errors |
☐ |
|
Storage |
Tablespace used %, autoextend headroom |
< 90% |
☐ |
|
Memory |
Buffer cache hit ratio trend |
> 90%, stable |
☐ |
|
Performance |
Top wait events, blocking sessions |
No new top event |
☐ |
|
Object/Security |
Invalid objects, expiring accounts, failed jobs |
0 unexplained |
☐ |
|
Backup Readiness |
RMAN report need backup, last test restore |
Within RPO window |
☐ |
5.3 Common Pitfalls
- Checking a value without a baseline, so there is no way to tell drift from noise
- Trusting a backup job’s success status without ever running REPORT NEED BACKUP or a real test restore
- Letting AWR retention quietly expire the only baseline that would have shown a slow regression
- Writing checks with no threshold or owner attached, so a red result has nowhere to go
- Treating the health check as a one-time audit instead of a recurring routine that gets easier to trust the longer it runs
5.4 Where This Fits in the Series
This guide sits on top of the same Oracle Database 19c environment used throughout this series. Backup readiness checks here point directly at the RMAN guide for the full recovery methodology; the same instance also runs ORDS, APEX, and any custom P2P/H2R schemas covered elsewhere in this series all of which benefit from the same availability, storage, and performance checks described here, since they all ultimately share the one database being checked.
The Most Important Habit
Run the same checks the same way, on the same schedule, every time. A health check’s value comes almost entirely from comparability over time a brilliant one-off audit is worth far less than a mediocre check that has run consistently for a
- Complete Doc for DB Health check
Complete Doc for DB Health check